The Startup Guide To Managing Your Email Reputation

(and avoiding the spam folder)

Email is a powerful engagement channel, even in the age of mobile and push notifications. However, if you’re a startup, setting up your email sending infrastructure and monitoring your reputation can be overwhelming and complicated. I’ve seen multiple startups that have struggled with email reputation issues and having their emails end up in the spam folder. This guide is based on what I’ve learned from working in email for many years at a scale of sending billions of emails per month. First I’ll break down the basics of setting up some of the technical configuration (DNS records, domains, IP pools, etc.,) to create a reputational firewall between the different types of email you send. Then I cover operational tips on how to manage and protect your sender reputation so your emails don’t end up in the spam folder.

How To Set Up Your Email DNS Records

This section is quite technical, so feel free to skip ahead to the next section (Domain & IP Pools) if you aren’t interested in hearing the gory technical details on how to set up your email DNS (Domain Name System) records. Setting up your email DNS records can be complicated because email requires a number of different DNS records to implement various protocols that have been developed over the years. You will need to set up the following records to send and make sure email service providers (ESPs) can authenticate your email and your reputation is protected:

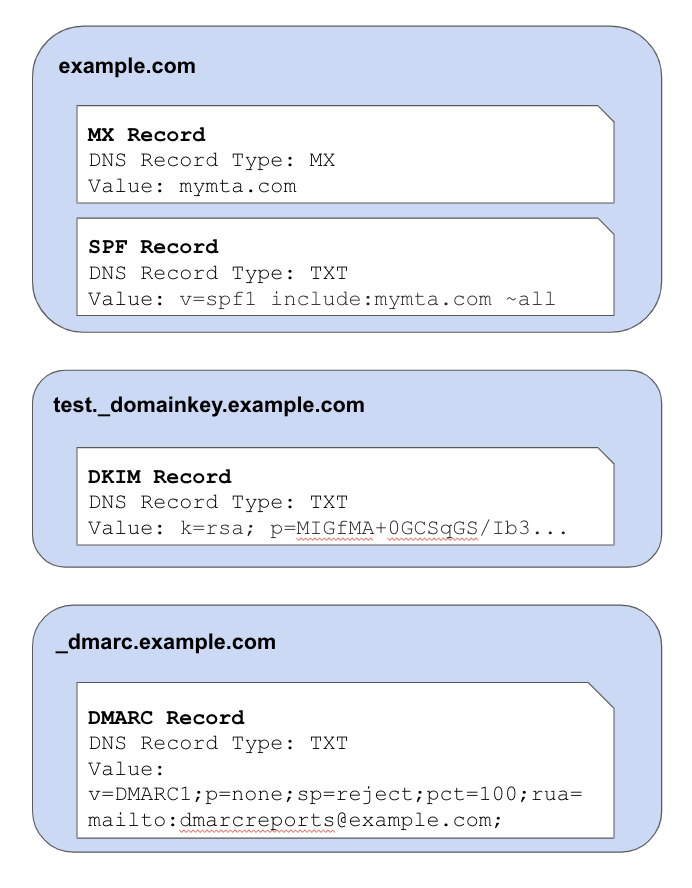
MX Record – The MX record is a DNS record that goes under your domain (ex: mymta.com) which instructs people trying to send to that domain which servers they should send them to. This will be the servers of your Mail Transfer Agent (MTA), which is the company you use to send/receive email (ex: Amazon SES). Or, if you decide to go the DIY route instead of using an MTA, you set up a few servers running postfix/sendmail, create a subdomain (ex: mxa.example.com) with an A record pointing to the IPs of those servers, and then point your MX record to the subdomain(ex: example.com would point to mxa.example.com).

PTR Record – The PTR record enables what is known as a reverse DNS lookup. ESPs use this as a simple spam check when receiving an email from a certain IP by verifying what domain that IP belongs to. If you’re using an MTA with a shared IP, you won’t need to set this up. However if you are managing your own dedicated IPs, you can read more about how to set up your PTR record here.

SPF Record – This is a TXT DNS record that goes under your domain (ex: example.com) that is used as part of the Sender Policy Framework. Basically, it is a way of specifying which IPs are allowed to send emails for your domain. It will typically look something like “v=spf1 include:mymta.com ~all” where example.com is the domain of your MTA. One common mistake when companies use multiple email services is they will create separate SPF records for each service. Technically the SPF standard stipulates there should only be one SPF record and if you are using multiple email services you need to concatenate them like this. Some ESPs will correct for multiple SPF records automatically, but not all of them do.

DKIM Record – DKIM is another TXT DNS record which goes under the <selector>._domainkey.<your domain> (ex: test._domainkey.example.com). This record is needed for the DomainKeys Identified Mail protocol. The way it works is you cryptographically sign an email using a private key and then add the DKIM-Signature header to the email including the cryptographic signature and a pointer to the DNS record containing your public key. When an ESP receives the email it can then automatically look up your public key using the DKIM-Signature and authenticate the sender was authorized to do so. Without DKIM, any other customers of your MTA could potentially spoof sending emails as you.

DMARC Record – This is a TXT DNS record that goes under _dmarc.<your domain> (ex: _dmarc.example.com) which implements the Domain-based Message Authentication, Reporting and Conformance (DMARC) protocol. It basically instructs email service providers on what to do if they receive an email purporting to be from your domain but fails the SPF or DKIM check. You should set your DMARC policy to “reject” so that ESPs will not accept emails from spammers attempting to spoof your emails.

Simple example of email DNS Records

How To Set Up Your Email Domains & IP Pools

Email service providers assign a reputation to domains, subdomains, IP addresses, and sender email addresses, and use these reputation signals in combination along with the content of the email to decide if an email is spam and if it should be delivered to the receiver’s inbox. The reputation is based on historical engagement rates and reported spam rates the email service provider has seen in the past from that IP, domain, etc.

Domains

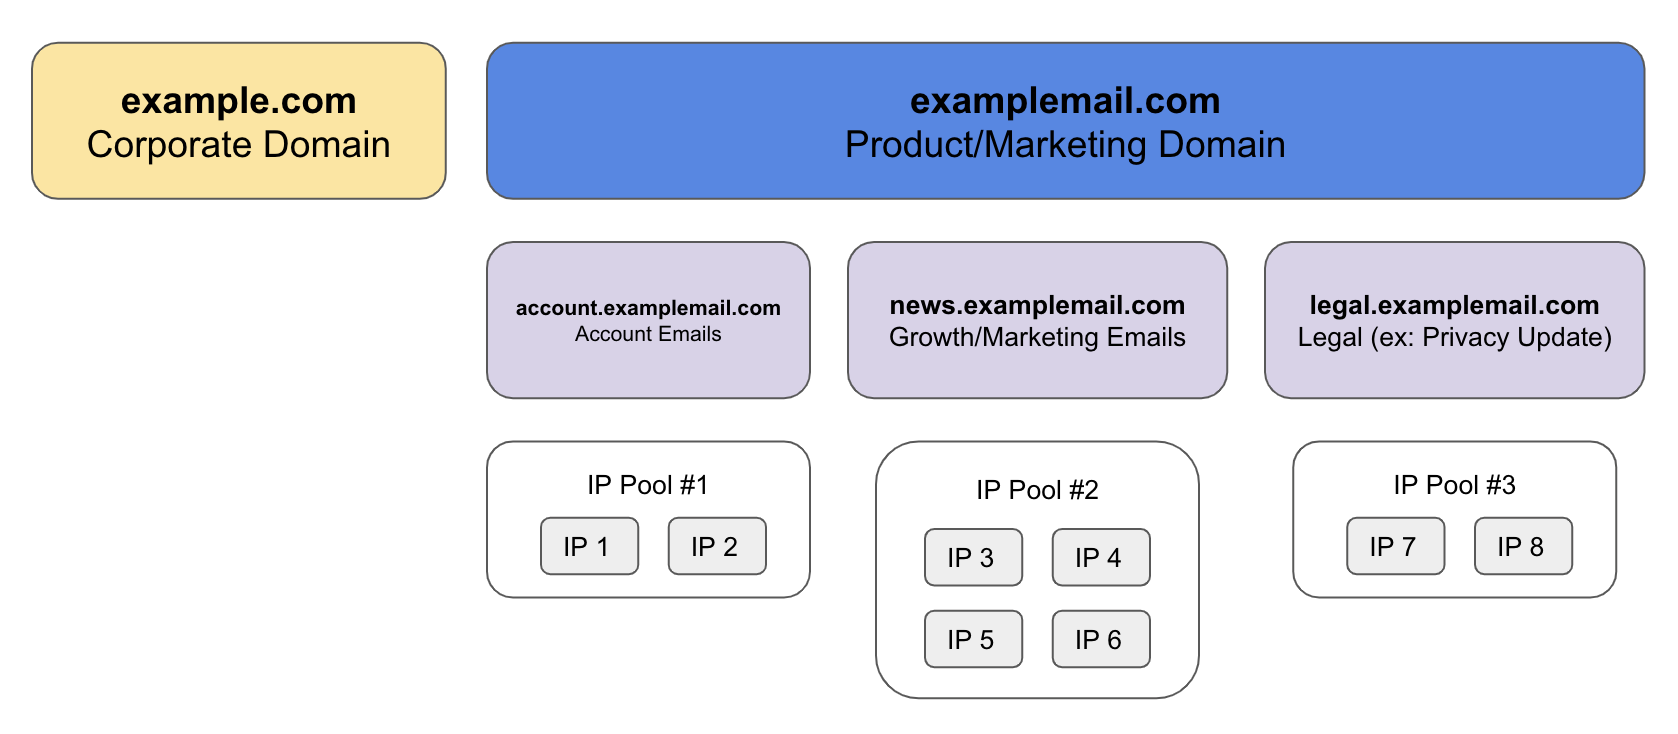
When it comes to setting up your domains, IPs, etc., the number one rule is to create a reputational firewall between your different classes of email. You don’t want to send a newsletter out that has poor engagement and cause your users to suddenly stop receiving their password reset emails, or even worse, cause all your corporate email to get marked as spam and you can no longer communicate to clients, vendors, lawyers, etc. (there are companies this has happened to before!) Follow these two rules on how to structure your email sending domains:

Rule #1: Separate your corporate emails and product/marketing emails into completely separate domains. A couple examples of how people do this: Facebook uses fb.com for corporate email and facebookmail.com for product/marketing emails. Slack uses slack-corp.com for their corporate email and uses slack.com for their product/marketing emails.

Rule #2: Create separate subdomains for different classes of email. For instance, you may want to use account.example.com for account emails such as password resets and news.example.com for marketing announcements.

IP Addresses

You have a few choices when it comes to what IPs you send from.

Shared IPs – This is the cheapest option, where the IP you send from will be shared with other customers of the MTA that you’re using. The reputation score assigned to your email will be influenced by the quality of email from every other sender that is sharing that IP. MTAs will also aggressively clamp down on allowing you to send from a shared IP if your email has high spam rates. On the plus side though, the shared IP already has an established reputation, so you can ramp up and down in volume relatively quickly without much trouble.

Private IPs – This option is more expensive but gives you much more ownership over your reputation because you’re not sharing the IP with anyone else. The downside is IPs need to be “warmed up,” which means you need to ramp the volume of email you’re sending from the IP slowly over time. Start off with sending a couple dozen emails per day and then increase by 50%-100% per day at lower volumes. Start to taper the increases to 15-20% increase per day as your volume really starts to ramp up until you reach your target volume. This warm up period is necessary because a common pattern for spammers is to get a new IPs and then immediately start blasting out a ton of email, so ESPs are very wary of sudden significant increases in volume. Ramping up slowly helps give ESPs time to start to measure and understand your reputation as a sender.

Bring Your Own IP (BYOIP) – Not all MTAs support this, but BYOIP is similar to private IPs; instead of the IP being owned by the MTA, they are owned by you. This option can help you avoid vendor lockin or going through the pain of ramping up new IPs if you ever decide to switch to a new MTA. However, in most cases you need to purchase a minimum block of 256 IP addresses (a /24 IPv4 block) which makes this the most expensive option in terms of upfront costs.

Two tips when it comes to managing your IPs:

Tip #1: Decide how many IPs you need. You probably want to start with 2-4 IPs per sender subdomain at a minimum. For higher volume subdomains, allocate more IPs. Start to scale up when the email queues start to back up on your end or the receiver end. Many smaller ESPs have limitations on the number of emails they can receive per second from a single IP (I’m looking at you orange.fr.) If you’re starting to exceed the capacity you will likely start to see SMTP 421 or 451 response codes that indicate the receiving ESP is rate limiting and you may need to scale up your number of IPs.

Tip #2: To help protect your reputation, you can set up a subdomain and small IP pool purely for testing riskier experiments. Keep the subdomain and IP pool warm by sending normal product email traffic through it. When you want to test a riskier experiment, such as emailing a bunch of dormant users, you can channel the emails for that experiment through this test pool to monitor how it impacts delivery and reputation of the test pool and avoid potentially harming your established domains and IPs.

Email List Management

Email service providers also use engagement rates (open rate, clickthrough rate, and spam report rate) as strong signals for reputation. Besides the content of your email, the audience that you send to can have a huge impact on email reputation.

Decide between double opt-in and single opt-in. Single opt-in is when someone signs up for your website and you start sending them email. Double opt-in is when they sign up, you send them an email confirming their email address and they must click that email for you to keep sending to them. Double opt-in results in a cleaner list of emails but has less reach, so decide what is best for you. Especially if you’re having reputation problems or issues with fake signups (see email bombing), you may want to consider double opt-in. There are also services like BriteVerify that check email addresses to see if they are real accounts through a combination of opening an SMTP connection to see if the domain and account exists on the SMTP server and also combining data from across all their customers.

Once you’ve added an email address to your list, you also need to periodically go and remove email addresses for accounts that have not used your product or opened any of your email in the past 3-6 months even if they have not unsubscribed. There are a few reasons you should do this:

1) The ROI from sending to these accounts is almost always very low because they have been ignoring all your past emails.

2) These accounts have really low engagement with your emails, significantly dragging down  your overall open rate and clickthrough rate and impacting your sender reputation.

3) Sometimes anti-spam companies acquire expired domains, sit on them for a while, see who is still sending to those domains and mark those companies as spam.

Managing Email Unsubscribes

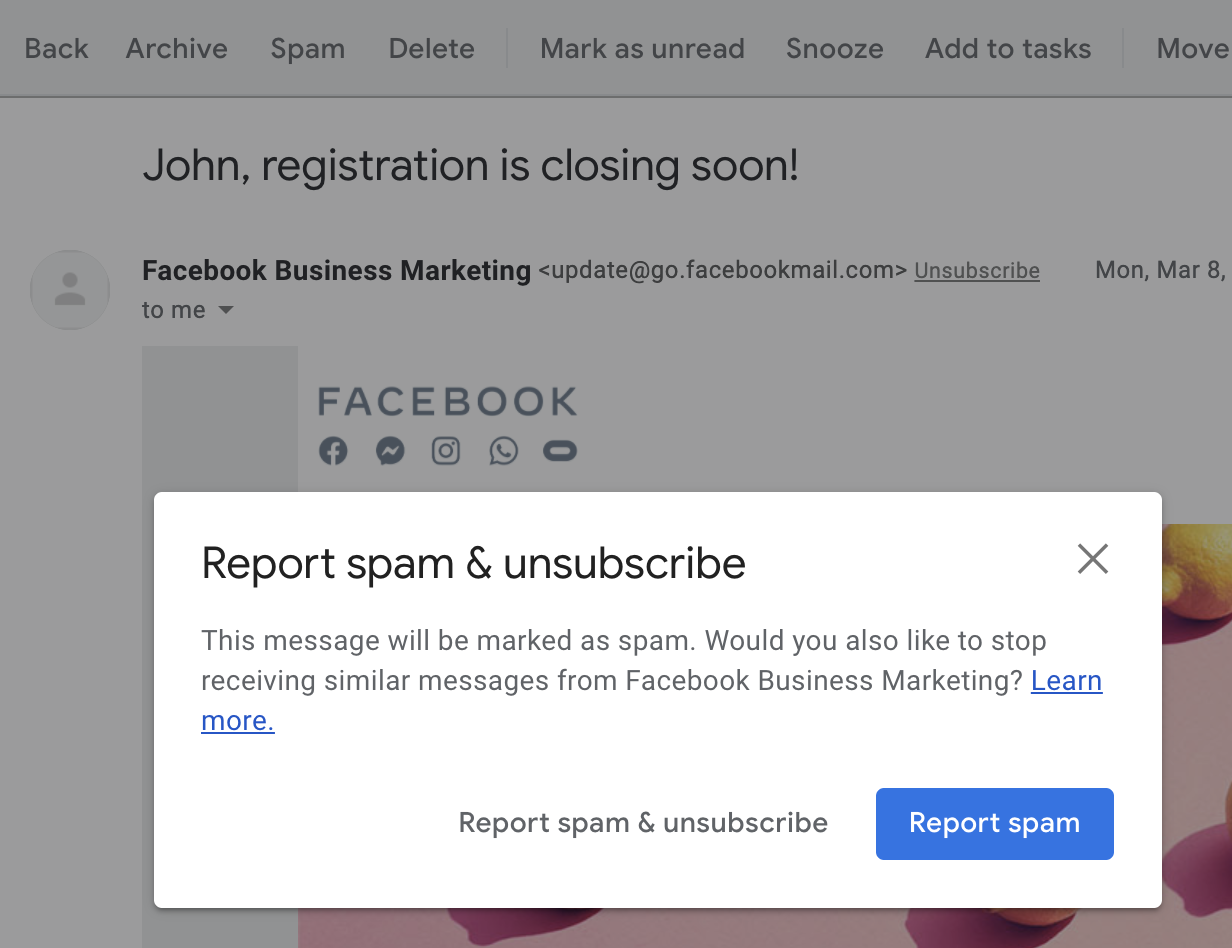
The number one mistake startups sometimes make when it comes to unsubscribes is they make unsubscribing difficult. They think that  if they make it challenging, the person will give up, stay subscribed and eventually become a user. What people really do if your unsubscribe flow is too difficult is go back to their inbox and mark you as spam which hurts your sender reputation. So here are some dos & don’ts for unsubscribes:

Don’t

  • Make your unsubscribe link hidden or hard to find.
  • Require users to sign into an account in order to unsubscribe. 

Do

  • Include the List-Unsubscribe header in your email. Some ESPs will provide a native unsubscribe button in their UI that utilizes this List-Unsubscribe header. When a user clicks that button, the ESP will send you an email notifying you that the user wishes to unsubscribe.
  • For sending to US based users, include your company’s postal address in the footer of every product/marketing email. This is not strictly tied to unsubscribes, but it is a legal requirement under CAN-SPAM or you risk a $40k fine per violation. This requirement informs consumers on who is mailing them and ensures consumers have a way of contacting the sender.

When it comes to making changes to your email program to try and keep more people opted into your mailing list, you should be acutely aware that unsubscribes follow exponential decay functions based on the number of days after signup. This leads to a heavy survivorship bias in the current set of users opted in to your emails. If you really want to see how changes to frequency, content or your unsubscribe flow impact users unsubscribing, you need to look at how that experiment impacts brand new users.

How To Monitor Your Email Reputation

There are services out there which help you monitor your reputation. However, if you’re sending at scale, I’ve found one of the most effective ways to monitor reputation is to just monitor mail acceptance rate, open rate, and clickthrough rate by receiver domain. The first thing to monitor is look for gradual declines over an extended period of time. Compare the number of unique opens and clicks this week to 4 weeks ago for a particular domain and look at the domains with the biggest percentage declines. To reduce noise, make sure to filter out domains that had low volume both weeks since small sample sizes can have high variance. The second is looking for receiver domains whose send volume is relatively high but the open rate, clickthrough rate, etc., are 2 standard deviations below average. This can help you identify problem domains and you can start to dig in and investigate to figure out what is wrong. Some things to look at are the SMTP codes returned when emailing to those domains, patterns of suspicious user signups using those domains, or potentially reach out to the company and see if they are willing to take a look at why your email isn’t getting delivered.  

Different players in the email ecosystem also provide their own tools to help you monitor your reputation:

1) AOL, Yahoo, Hotmail, etc., provide a complaint feedback loop where they will forward you emails that their users have complained about or reported as spam. This can be valuable for diagnosing why some people are marking your emails as spam by digging into patterns on who is unsubscribing or what emails they are unsubscribing. For instructions on how to register for the feedback loops of various ESPs, go here.

2) Gmail unfortunately doesn’t forward specific emails that are reported as spam, but you can get a very simplistic view of how Google views your sender reputation by registering for Gmail’s Postmaster Tools. A reputation of anything less than high (green) would likely result in degraded delivery rates to Gmail users.

3) Microsoft has Microsoft Smart Network Data Services (SNDS) which allows you to monitor your IP reputation with msn.com, hotmail.com, etc.

4) Set up [email protected] and [email protected] and make sure they go to a monitored inbox so you can deal with spam complaints. 

5) Spam blacklist providers such as SpamCop, SpamHaus, etc., also will report back on email reported as spam if you register an abuse@ email at abuse.net.

Managing Your Email Program

Finally, now that you have your email systems all set up, you want to protect your reputation and make sure you don’t accidently tank it; getting out of a poor sender reputation can be painful and take a lot of time (usually minimum 4+ weeks).

The emails that hurt reputation are emails with poor clickthrough rates and high spam report rates. What good open and clickthrough rates look like varies by industry, but at a bare minimum you should aim for >10% open rate and >10% click to open rate. Good would be 2x-3x higher than that. Your spam complaint rate should be <0.1%, and good would be ~3-5x lower than that. A few patterns that most commonly result in poor engagement rates and high spam rates and can hurt your reputation if you are not careful are:

  1. Mass mailing the entire user base with a newsletter or feature announcement emails.
  2. Sending emails to large numbers of dormant users.
  3. Going from never sending users email at all, so suddenly sending them email. If you haven’t sent email before, start off with only emailing recently active users.

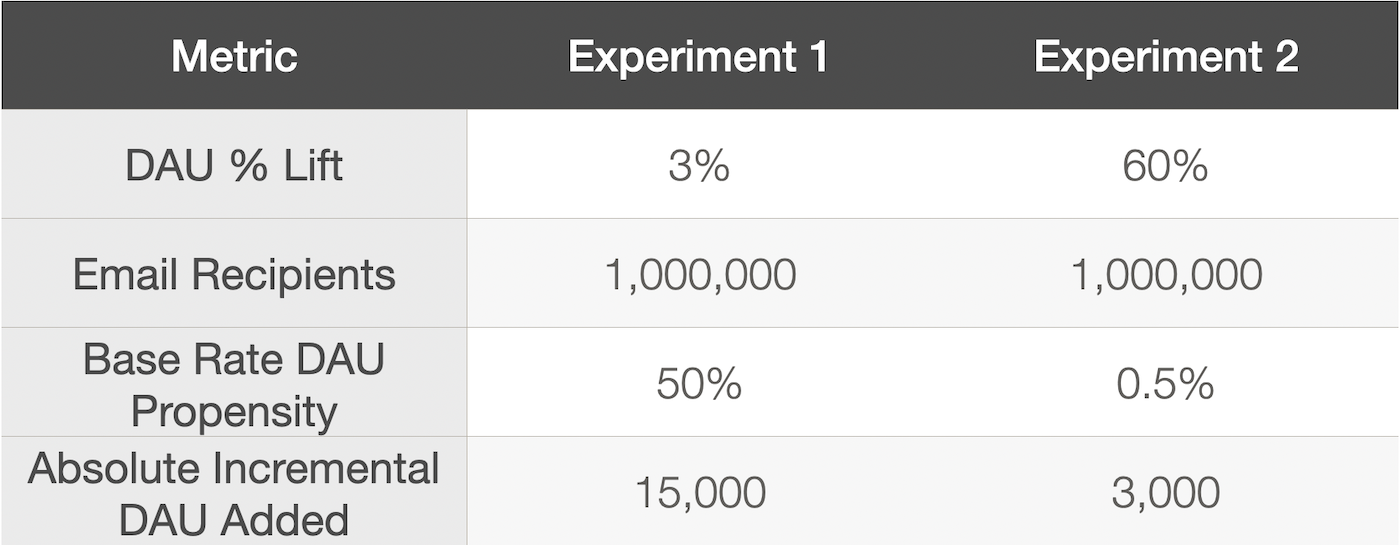
To prevent shooting yourself in the foot, you should have a required process in place for testing any new email your company sends. Whether it is a new automated email or a one-off marketing email, you should ensure the engagement rates on the email are good enough to merit scaling out. To do this you should do a test send to a small subset of eligible recipients (something like 0.5%) and measure the open and click rate compared to the average open/click rate for those recipients. You want to calculate the average for that specific set of recipients rather than your overall average open/click rate because different audiences will have very different baseline engagement rates with your email (ex: engaged users will click a lot more than dormant users.) If the engagement rates on the test email are near or better than average for the audience, then you should be able to safely ramp up the send. If the volume will be more than 2x your normal volume, you may need to spread out the send over multiple days because ESPs don’t like sudden significant spikes in volume. If the engagement rates are significantly below average, then that indicates consumers don’t find your email useful and you should strongly consider not ramping it up any further because it could potentially harm your sender reputation.

Hopefully this guide helps demystify some of the mechanics behind email reputation management and will help you ensure your emails don’t end up in the spam folder. 

Top 10 Mistakes In Running A Growth Team

I’ve been working in Growth for 10 years now and I wanted to reflect on the top 10 mistakes I’ve seen teams make from either teams I worked on directly or mistakes I’ve seen from talking to Growth teams at other startups over the past 10 years. For each lesson I also linked to an applicable blog post that goes into detail if you’re interested in finding out more. So, without further ado, here are the top 10 mistakes I’ve seen in Growth.

1) Using Percentage Gains

The first mistake I see for teams new to Growth is looking at all experiment results in terms of percentage gains instead of absolute number of incremental users taking an action. Percentage gains are meaningless because they are heavily influenced by the base rate for the audience in the experiment, but each experiment has different sets of users that have a different base rate. For example, if you send an email to a set of low engaged users and increase DAU amongst that group by 100% and send a different email to a set of highly engaged users and increase DAU by 5%, it is hard to tell which experiment was actually more impactful because the base rate for the propensity to be active is very different for those two groups. Experiment impact is the currency of Growth, so you should always use the absolute number of incremental users added for each experiment rather than percentage gains. 

Read More: The Wrong Way to Analyze Experiments

2) Goaling On The Wrong Metric

Mistake #2 is goaling on metrics that are not tied to long term business success. A classic example is goaling a team on signups. Driving a ton of signups without retaining any of the users might make topline active user numbers look good for a bit, but they will eventually collapse when many of those users churn. You want to goal and measure on a metric that is indicative of users getting value from the product and long-term success of the business. However, be aware that if you choose an action that is too far down funnel, you may find that you are often unable to get statistical significance on any of your experiments. When picking a metric, you have to strike the right balance between a metric that indicates the user is getting value from the product, but is not so far down funnel you run into issues with statistical significance. 

Read More: Autopsy of a Failed Growth Hack

3) Not Understanding Survivorship Bias

Survivorship Bias is a logical error where you draw insights based on a population but fail to account for the selection process that created that population. This can show up in a number of ways in Growth. A few examples:

  1. Your existing active userbase is a biased population since they got enough value from the product to stick around, while those who did not get enough value churned. This bias can impact experiment results when making major product changes such as introducing a major new feature.
  2. For products at scale, conversion rates can decay over time. As more people see a conversion prompt and convert, you’re left with an increasing percentage of the population who have already seen the conversion prompt multiple times and did not find it compelling enough to convert.
  3. Your email program has a big survivorship bias because people who don’t like your emails quickly unsubscribe. This can impact experiments when making big changes to content or frequency. You may not see what the true long-term impact of that change would be unless you zero in on how it impacts brand new users.

The way to overcome survivorship bias is to figure out if there is a way to identify a less biased population (ex: new users) and make sure to look at that segment of users when analyzing the experiment.

Read More: One Simple Logic Error That Can Undermine Your Growth Strategy

4) Not Looking At User Segments Critical To Future Growth

One major lever for growing your userbase is expanding your product market fit to users that aren’t big users of the product today. Examples could be expanding the product to new industries, verticals, demographics, counties, etc. However, your existing core audience will dominate experiment results since they make up the majority of the userbase today. When going after new audiences, it is important to look at not just the overall experiment results, but also segmenting the experiment results and looking at how it impacted audiences you are trying to expand into. You should do this for all experiments, not just the experiments targeted towards that segment. Otherwise, you may keep shipping things that are good for your core audience but may not be a fit for audiences where you hope your future growth will come from. 

Read More: The Adjacent User Theory

5) Not Having a Rigorous Process for Setting Your Roadmap

On the first Growth team I worked on, the way we decided on our roadmap was by brainstorming a bunch of ideas on a whiteboard and then having everyone vote on their favorite ideas. The ideas with the most votes made it into our roadmap and what we ultimately worked on for the quarter. After using this process for a couple quarters, we started to realize that a lot of the experiments coming out of this process were not generating a ton of impact. Introspecting on that process we realized some of the deficiencies with that approach were 1) ideas were not well researched and just based on what people could think of off the top of their heads, and 2) votes were made in the absence of data and were based on gut feeling which was often wrong. I’ve become a huge believer that the single biggest lever for a Growth team to increase its impact is to improve their process around how they come up with experiment ideas and how they decide which experiment idea to work on. At Pinterest we implemented a process we called Experiment Idea Review where every member of the team comes up with an idea, takes time to research it and dig into the data, then pitches it to the team and the then has a discussion to decide if we should pursue it. 

Read More: 

How Pinterest Supercharged Its Growth Team With Experiment Idea Review

Managing Your Growth Team’s Portfolio: A Step-by-step Guide

6) Not Staffing Teams Correctly

There are three ways I see Growth teams incorrectly staffed:

  1. Startups trying to start an initial Growth team with just 1 or 2 engineers. For early-stage startups (e.g. <10 employees), Growth should be everyone’s job. When you get to the point though of forming a dedicated Growth team, you need a minimum of 3 engineers to start the team. With any less than that, the team cannot move quickly enough because they are stretched too thin.
  2. Staffing teams with engineers that are not going to be retained on the team long term. Growth often involves a lot of iterative experimentation. Generally, the engineers that often do best in Growth are often motivated by driving business impact, are full-stack and capable of working across different platforms and technologies. Engineers that are primarily motivated by building big new features or solving big technical challenges (although Growth does have some big technical challenges!) tend not to be retained in Growth because they don’t find the work in Growth motivating.
  3. Not having the right skill sets in the team. This can come in two flavors: overreliance on other teams or just not having the right level of expertise. Moving quickly and having a high velocity of experimentation and iteration is critical to a Growth team’s success. For instance, if the company has a centralized iOS team that implements everything on iOS and the Growth team needs to constantly request time on that team’s roadmap to implement things instead of being able to do it themselves, the reliance on the iOS team will really slow the Growth team down and create a lot of friction in getting things done because different teams have different goals and priorities which then need to be negotiated to get on the roadmap. The other flavor is not having the right level of expertise. If a team is faced with a problem set that is best solved through machine learning and they don’t have machine learning experts on the team, the team may try to solve the problem using non-ML approaches which are not as impactful or attempt to tackle the problem using ML, but not have the expertise to successfully deliver an impactful solution. 

Read More: 

3 Habits of a Highly Effective Growth Team

Hiring Growth Engineers Is Not Impossible

7) Losing Sight Of The Goal

Growth teams generally have a metric goal for the quarter. In some of the early Growth teams I was on, as we executed on the quarter, we were heads down and focused on the roadmap and shipping experiment on a week-to-week basis and didn’t really check in on the goal very often. In spite of this, we kept hitting goals until finally one quarter we missed our goals and missed by a large margin. 

What we realized is we needed a process to regularly review how we were doing on a weekly basis so we could be nimble and make adjustments. In our team weekly meeting, we started reviewing how we were doing relative to goal. It was also important to have a trendline to help us determine how we were pacing relative to goal and help us understand if we were ahead or if we were falling behind. Having this process really enabled us to catch early on if we were falling behind goal and rally the team to figure out what we could do to get back on track.

Read More: 

The Right Way To Set Growth Goals

5 Principles For Goaling Your Growth Team

8) Building Features Hoping They Drive Growth

In enterprise software, building features often correlates with growth because it increases the number of customers whose requirements you now meet. However, I sometimes see consumer startups invest a ton of time building many features or go through big redesigns in hopes that they will drive user growth or engagement. Features can drive growth; some good examples are when Facebook added the ability to upload photos and tag your friends or when Snapchat added Stories. However I see consumer startups all too often building features because it is cool or exciting and hoping it will drive growth without understanding what makes a feature drive growth. In consumer products for a feature to drive growth, it generally must meet the following criteria:

A) The feature has to impact the majority of the userbase (i.e. it can’t be for a niche set of users, except in the scenario where building the feature for that niche set will then have a much bigger impact on the rest of the userbase).

B) The feature creates an engagement loop. Typically, the engagement loop is created by notifying users on a regular basis. The content in those emails and notifications in that engagement loop needs to be compelling enough that it maintains a high engagement rate over time.

C) The feature is a step-change improvement in the core value of the product for a majority of the userbase.

Taking Snapchat Stories for example, it is clear how it fit these three criteria: 

A) Stories was available to the entire userbase and I suspect the vast majority of their active users posts to their story or views the stories of others.

B) Stories disappeared after 24 hours which created an engagement loop by getting users to build an internal trigger to check the app regularly to view the stories of their friends or risk missing out on seeing what their friends were up to. For less engaged users, Snapchat would notify them when a friend posted a story to bring them back.

C) Stories were a big increase in product value for Snapchat. Instead of just being a direct messaging product to send or receive messages from close friends, Stories significantly increased the amount of engaging content available to users.

Read More: When Do Features Drive Growth?

9) Getting Stuck In A Local Maximum

Growth involves a lot of iteration and optimization. That can sometimes lead to optimizing yourself into a corner, where there may be a better performing experience out there, but you cannot iterate your way to it because every step iteration from your current experience will be negative. 

To get out of this local maximum you need to make a bet and try a few divergent experiences. It is unlikely any of those divergent experiences will beat your control off the bat though, since you have spent months or years optimizing your current control experience. You need to be willing to invest in multiple iterations on those divergent experiences until they start to outperform control.

Read More: How To Get Over Inevitable Local Maximum?

10) Big Bets Without Clear Milestones

That brings us to our last mistake, which is making big bets without clear milestones. I’ve seen times when teams have executed on big bets without a plan or regular checkpoints to decide if the bet is worth continuing. I’ve also seen times when a team takes on a big bet with a mentality that it will ship at all costs and failure is not an option. In either of these two modes, if the bet doesn’t pan out as expected, the team can then be stuck in a tough situation where they have invested a large sunk cost, things aren’t making progress, but the team keeps plodding along trying to get the bet to work. This can come at the cost of not investing those resources elsewhere into something that is working or at the cost of not taking a step back and pursuing a different approach. When taking on a big bet, it is crucial to set up a regular cadence for reviewing the status of the bet, making a go/no go decision on if the team should continue to invest in the bet, and setting out a clear plan and milestones upfront to help inform those checkpoints and go/no go decisions. 

Read More:

Managing Your Growth Team’s Portfolio: A Step-by-Step Guide

The Impactful Redesign

I hope that after reading these 10 mistakes and lessons you can learn from them and can avoid some of the biggest pitfalls I’ve seen in the past 10 years in Growth.

The 5 Rules Every Growth Team Should Follow for Effective Collaboration

In product-led Growth, some of the biggest opportunities can require working across product boundaries and partnering with other teams. When collaboration goes well it can deliver big unlocks, help build a seamless user experience, and avoid the trap of your product reflecting your org structure. Collaboration not done well can cause friction, contention, and put a damper on future efforts to work together. Here are my five rules that Growth teams should follow to ensure happy and effective collaboration.


1) Come With The Problem, Not the Solution

When you have an idea for an experiment you want to run, the first rule when approaching another team is to start with the problem, not the solution. Avoid starting off by telling them what experiment you want to run right off the bat. While you may have ideas in mind, begin with the user problem you are trying to solve and work together with the other team to ideate potential solutions to that problem. The benefits of this is a) it will be perceived by the other team as more collaborative and open b) it encourages the other team who has more experience in that particular domain or product area to be more engaged in thinking about solutions rather than just approving/disapproving your experiment idea.


2) The Right of First Refusal

The right of first refusal is a concept in contracts. A classic example is when investing in stock in a private company, the stock agreement may have terms that give the company the right of first refusal when you sell the stock. This gives the company the right to decide if they want to purchase the stock back from you before you are allowed to sell the stock to a third party. The reason this exists is so the company can control the number of shareholders they have to avoid the rules and regulations that come with having more than 500 shareholders.

When it comes to collaboration, sometimes there can be contention over who does the work. I’ve found this idea of “right of first refusal” useful in helping ensure smooth collaboration. The idea is if the team that owns the product area you want to work on really wants to implement the idea themselves, go ahead and let them since you get the idea implemented and it frees you up to go work on other ideas. There are a number of good reasons the team that owns the product area may want to implement the idea themselves, such as a) they are concerned about the risk of something critical breaking, b) maybe they already had the same idea and had been promising it as a career development opportunity to someone on their team, etc. However, if the other team does take on the project, they need to explicitly commit to getting it done in a reasonable timeframe. My rule of thumb is that the timeframe should be no more than 4x the amount of time it would take to implement the project (ex: if it takes 1 week to implement, the other team should commit to getting it done in the next 4 weeks). If both teams agree that the experiment idea has merit, but the other team can’t commit to completing it within that time and your team has an engineer ready to work on it, it is hard to see a compelling argument for why the experiment should be substantially delayed when there is a team is willing to do the work now.


3) Pre-Align on What Success Looks Like for Controversial Experiments

Sometimes there are experiments in Growth that can involve tradeoffs between metrics impact vs. more qualitative aspects (ex: branding, user experience, etc). For instance, in 2016 Pinterest changed the “Pin it” button to say “Save” to help make the button better understood by a global audience. It was a seemingly simple change, there was some controversy because there was a lot of branding built into “Pin it” vs. “Save” which was more generic. I’ve found that for controversial experiments it is best to align on shipping criteria before the experiment is even launched. Waiting for the experiment results to come in before aligning on what bar the experiment needs to meet to ship it, people tend to stick to the biases they had for which variant they preferred. Pre-aligning on ship criteria before either side has any data leads to a much more principled conversation on the tradeoffs between metrics vs other qualitative aspects. Then once you have alignment you simply run the experiment and see if the results meet the bar for the pre-agreed upon shipping criteria.


4) Communicate, Communicate, Communicate

So you’ve reached the point where you’ve agreed on the experiment you want to implement and the shipping criteria and it is now time to go into execution mode. It is important to thoroughly communicate every step along the way to make sure the other team is well informed on what is happening. Let them know when your engineer starts working on the project, when the experiment is launching, when it is being ramped up, when it is shipping and include the other team on code reviews. Communicating every step of the way ensures there aren’t any unexpected surprises for the other team and can also reduce the risk of potentially having conflicting experiments live at the same time.


5) Cleanup After Yourself

The final rule is to be respectful of the other team’s code base and take the time to properly ship it or shut it down when the experiment is done. That means really being disciplined about writing unit tests, integration tests, documentation, implementing alerts, etc. if the experiment is being shipped, or deleting the code and confirming it is removed if the experiment is shut down.


To wrap up, every company culture is and can place different emphasis on quality, velocity, impact, collaboration, etc so use these five rules as a guide and adapt them in a way that makes sense for your company’s culture.

How Pinterest Supercharged its Growth Team With Experiment Idea Review

Written by Jeff Chang & John Egan

Growth teams need to be organized bottom-up to scale well

The Pinterest Growth team has over 100 members, and we’ve run thousands of experiments over the years. It’s difficult to run that many experiments and still maintain a high success rate over time. We’ve found the traditional growth team model of team leads deciding which opportunities to try didn’t scale well as our team grew. Increasing the number of high-quality ideas ready for experimentation is one of the biggest levers for increasing the impact of a growth team, but our leads have less and less time to research and find great opportunities as we continued to scale the team.

To address this, we changed the structure of our Growth team to be bottom-up, meaning everyone — engineers, product managers, engineering managers, designers, etc. — is expected to contribute quality experiment ideas. However, this model immediately runs into the reality that finding great growth opportunities is a rare skill that usually only comes with experience. We developed Experiment Idea Review (EIR) as a way to quickly train team members to find high-quality growth opportunities and continuously build our idea backlog. The rest of this post describes how to run EIR effectively.

An inversion of the traditional growth team model for experiment ideation. Dotted lines represent the ongoing growth of the team. Enabling everyone to generate high-quality experiment ideas scales much better than the top-down model.

Experiment Idea Review Guide

What is Experiment Idea Review?

In a nutshell, EIR is a recurring meeting to pitch ideas. It has two main goals: (1) train team members how to come up with quality ideas and (2) build a sufficient backlog of high quality experiment ideas. EIR can be run at various intervals (e.g., weekly, monthly) depending on how many quality ideas the team needs for a healthy backlog, but the more practice everyone gets, the better they become at originating high-quality ideas.

It’s important to note EIR is not a brainstorm. At Pinterest, we historically used brainstorms to generate growth experiment ideas. We would get everyone together in a room and have each person come up with ideas off the top of their head, which we would then try to feed into our roadmap. However, we’ve learned simple brainstorms tend to only be effective when the goal is to come up with solutions to very specific, scoped problems (e.g., the email open rate for dormant users is good, but the clickthrough rate is low — how might we solve that?). People are able to contribute much more when given sufficient time to research ideas ahead of time versus just coming up with ideas in the moment.

Experiment Idea Review Process

Before an EIR meeting, team members come up with ideas and spend up to an hour filling out an experiment idea doc. A well-written document quickly provides readers with enough detail to make an educated guess of the idea’s potential value, so the doc should be as detailed as possible.

An experiment document should contain the following components:

  • Problem statement:What user problem is being solved? (we always want our experiments to benefit users)
  • Screenshots & videos: What does the current user experience look like?
  • Experiment idea:What are the details of the proposed experiment’s design, setup, and goals?
  • Hypothesis:What will the experiment result in, and how will it significantly improve key metrics?
  • Opportunity size:How many users per day will see the experimental feature?
  • Estimated impact:Based on the opportunity size, what is the expected range of impact?
  • Investment:How much engineering/design/etc. time would be required to invest into this idea?
  • Precedence:Are there previous related experiments that our company or other companies have run? What can we learn from them? If we’ve run this type of experiment before, why will it work differently now?
  • Recommended Rating: Based on all of the above, should we work on this experiment immediately, put it in the backlog, or not prioritize it?

During EIR, you should plan on spending around five minutes for presentation and five minutes for discussion per idea. Leads should give extensive feedback about the idea, and the discussion should conclude with action items. Different teams can use different rating systems, but in general each rating should match an action item. For example, good action items are “work on immediately”, “move to backlog”, and “deprioritize”.

Best Practices

We’ve run into a few issues making EIR effective, and we’ve developed a few key best practices in response to them:

Problem: People don’t bring ideas
Solution: Create a schedule with assignments for specific people to bring ideas on specific dates. Managers need to set expectations that finding great ideas is required to succeed on a growth team. Consider pairing new and experienced team members so they can work on ideas together.

Problem: People don’t know how to come up with ideas
Solution: Teach people during onboarding how to find ideas through competitor audits, user flow walkthroughs, metrics deep dives, and examining past experiment results. Build a library of high-quality idea docs to serve as examples for new team members to learn from.

Problem: Idea quality is lacking
Solution: Note that this is expected when ramping up an EIR process. To accelerate quality improvement, leads should give significant feedback after every idea (there’s a feedback guide later in this post to help with what kind of feedback to focus on). Also, leads should emphasize that one good idea will generate more impact than ten bad ones and will take much less time to implement as well. It’s also important to set expectations around the amount of prep time that should go into researching an idea; typically, we recommend spending between 30 minutes and two hours prepping an idea for EIR.

Problem: Idea document is not detailed enough to give a rating
Solution: Have the leads collect the idea one-pagers ahead of the meeting so they can scan through and spot if any ideas are lacking sufficient detail. If they find any, ask the authors to flesh their ideas out, and reschedule the ideas for review in a later EIR meeting to avoid spending review time twice for the same idea.

Problem: Good ideas are not acted upon
Solution: For really strong ideas, assign owners to work on them right there in the meeting.

Feedback Guide

Here are some common feedback areas for helping team members improve the quality of their experiment ideas:

  • Opportunity size too low:If too few users see an experimental feature, the impact will be limited.
  • Impact estimate unlikely:It’s common for people to overestimate how much impact a proposed change may have.
  • Precedent not listed:New team members usually aren’t familiar with past experiments, so it’s good to share precedent learnings early and often.
  • Precedent listed without discussion:“Why will it work differently now?” should be answered for any listed precedents.
  • Investment size incorrect:People tend to underestimate how long projects will take. There is significant team overhead for each experiment, so you can’t just consider development time.
  • Ratings too lenient:Look at your past experiments and divide the amount of big wins (not including shipped but small win) by the total number of experiments. It’s likely a low percentage, which should encourage people to be critical about what experiments to commit time to.

For more information, watch the talk Jeff Chang gave at the SF Growth Engineering Meetup about bottom-up growth teams and experiment idea review:

Our Results

After running the EIR process for over a year, we’ve seen the following benefits across our Growth team:

  • Depending on the subteam, 50–100% of experiments are ideated by non-lead team members
  • We’ve scaled our Growth team to 100+ members while continuing to increase the overall experiment impact of each subteam
  • New team members are more effective since they’re able to more quickly learn about what the team has tried in the past and own new experiments with increased confidence.

Experiment Idea Review has helped the Pinterest Growth team scale its impact, and team members have enjoyed increased agency in deciding what projects they work on while also having more direct influence on their own personal impact and career growth. If you are an engineer, PM, analyst, or designer who wants to join a high impact bottom-up growth team, please check out https://pinterest.com/careers.

Thanks to the many people on the growth team who helped test and improve this process!

Originally published on the Pinterest Engineering Blog

Managing Your Growth Team’s Portfolio: A Step-by-Step Guide

Managing a Growth team in many ways can be like managing an investment portfolio. Each individual experiment or project is an investment and the goal is to maximize the long-term return (i.e. impact) of your portfolio. Having worked in Growth for almost 10 years I’ve seen how the portfolio of a Growth team can evolve over the course of several years. In this post I’ll cover the three major classes of projects that a Growth team works on and how Growth teams should be adjusting their portfolio allocation over time based on changing needs.

Three Asset Classes in Your Growth Portfolio

Growth portfolios are primarily made up of the following three “asset classes”:

Iterative Experiments – This is what Growth teams are best known for. Iterative experiments are A/B experiments in an established area. Examples could be changing the color of a button, building a new email type, etc. Typically, the average success rate for iterative experiments can range from 30% to 70% and often depends on the domain the team is working in.

Investments – These are either tech investments or user experience investments. Tech investments should increase the capacity of the team to drive more impact in the future. Examples include building a new tool to automatically localize copy experiments or refactoring a major piece of code to run experiments more easily in that area in the future. User experience investments are investments to make the product experience more delightful without the expectation of driving growth (or possibly even slightly hurting growth). The goal of user experience investments is to strike a balance between trying to drive metrics and protecting the brand reputation. Examples could include improving an email unsubscribe flow to make unsubscribing easier and clearer.

Big Bets – These are what they sound like – big bets to open up new opportunities. They take a lot of effort and have a lower probability of success, 20%-40%, but can be very impactful if they work. Examples are building out new growth channels or a complete overhaul of your new user onboarding flow.

Increasing Your Portfolio Returns

One of the most important ways to increase the return on your portfolio is picking the right investments to make (i.e. project selection). You have limited capital (i.e. engineering time) so it is critical to make wise investment decisions. When it comes to improving project selection there are two big levers:

Lever 1: Increase the rigor of your project selection process

In his seminal book on management, High Output Management, Andy Grove, former CEO of Intel states that a common rule we should heed is to detect and fix any problem in a production process at the earliest stage possible. In Growth, every experiment you work on has an opportunity cost. Every failed or low impact experiment you run was time that could have been spent working on a different experiment that maybe could have had a better shot at being successful. On the very first Growth team I was a part of, the way we selected projects was very democratic. We brainstormed a bunch of ideas, wrote them up on a whiteboard, and then people voted on which ones we thought we should do. What we later realized was that this is one of the worst ways to select projects because people vote without any data and just go on gut feeling. In hindsight, we realized that people were voting to work on flows that weren’t perfect and that they felt confident could be improved. However, the reason why those flows weren’t perfect was because they were often not that important or impactful. In Growth it is usually more impactful to make a small incremental improvement at the top of the funnel of a core flow than to fix a broken less used flow.

To improve how we selected projects, we introduced a much more rigorous process and started to calculate the expected value of the project per week of engineering work and picked the ones with the highest estimated ROI.

Expected Value = probability of success * # new active users / amount of engineering work

You are making an estimate for each part of this equation, but it is still helpful in comparing different projects. For estimating the # of new active users, it is helpful to not just pluck a number out of the air. You should start with a hypothesis on what metric you will move and by how much and then model out how that impacts your number of active users. For instance, if you think a new email subject line will increase the open rate by 5%, a rough way to model the number of incremental new users = # of clicks from the email * percent of clicks coming from dormant users * 0.05.

Lever 2: Increase the number of high quality project ideas

Once you have a good process to select projects, the second lever is to increase the pool of good projects you have to select from. To do this you need to make sure it is not just the Product Manager’s job to come up with ideas for the roadmap, but instead build a bottom-up culture where it is the job of every single person on the team to come up with ideas. That means every engineer, every designer, every analyst, should be required to contribute experiment ideas. When it is everyone’s job to contribute to experiment ideas, the number and pipeline of experiment ideas will dramatically increase. With proper training and feedback you can ensure that those ideas are high quality.

Lever 3: Maximize impact of every experiment you ship

The final lever is to make sure you are really maximizing the impact of every experiment you ship. The way to do this is related to lever 2 of building a bottoms-up culture. Every engineer should have ownership over experiments they are assigned to work on, even if it wasn’t originally their idea. What ownership means is that they should be striving to figure out how to make the experiment as impactful as possible by improving on the initial idea or by coming up with additional variants to test. Doing this will help make sure you are squeezing as much juice as possible out of every experiment. If a team of 10 engineers works on 120 experiments/quarter there is no way a single person can think deeply about each and every one of the 120 experiment ideas. Taking a bottoms-up model where the people spending the most time working on an experiment idea are empowered to come up with suggestion and figure out how to maximize that idea will help make sure you’re not leaving any money on the table.

Evolving Your Portfolio Over Time

While it is important to try and maximize your portfolio’s returns, it is also important to understand how the portfolio makeup needs to adjust over time. Growth teams typically go through three stages and how they allocate between different project classes should evolve with what stage they’re in.

Startup Stage:

For a Growth team at an early stage startup or a Growth team working in a brand new area at a mature company, there are a lot of unknowns. Not much has been tried, there is a lot of low hanging fruit, and a lot of foundational stuff might be missing. For instance, you might not have the dashboards you need or you might not even have an experimentation framework in place at an early stage startup. However, the team can’t just focus on investments the entire quarter. The team also needs prove to leadership that they can drive results and show they can move business metrics up and to the right.

At this stage you might want the following allocation:

Iterative Experiments (33%) – You will want to get some early quick wins to prove to leadership that the team can drive results. This will build confidence in the team and give you the space to work on projects that will pay off in the long term.

Investments (33%) – There are typically several foundational investments that need to be made early on to set up the team for long term success. It could be setting up logging pipelines, reports, etc.

Big Bets (33%) – Because there are so many untapped areas, the team needs to take a stab at a couple big rocks to start exploring the problem space, see what pays off, and start to form a longer-term strategy.

Growth Stage:

Typically, after 2-3 quarters a team has gotten some traction in the area and has started to figure out what works. This is where they enter the growth phase, where they typically really focus in on iterative experiments and driving impact. The growth stage lasts many quarters or years and this stage embodies what a stereotypical Growth team looks like.

Iterative Experiments (70%) – This is where the bulk of the team’s impact will come from.

Investments (15%) – Continue making investments to increase the team’s ability to drive long term impact.

Big Bets (15%) – Continue making some big bets to open up new opportunities for the future.

Mature Stage:

Finally, after a team has worked on an area for a long time and has spent many quarters, or many years picking off the low hanging fruit you can start to reach a local maxima where the team has really milked a strategy or an area for all its worth. You’re starting to reach a point where you are faced with making a call on if you should pause working on this area entirely or if it is time to try and break out of that local maxima.

Iterative Experiments (30%) – You should significantly ramp down how much time you’re spending on iterative experiments, but you probably still have some backlog of experiment ideas you still want to work through.

Investments (10%) – Pause most work on investments unless they are tied to the big bets.

Big Bets (60%) – Big bets ramp up significantly to try and find new opportunities and break out of the local maxima. When in a local maximum, it is important to note that you probably have spent quarters or even years optimizing what is now the current control experience. Your first stabs at a radically different approach likely won’t beat control off the bat and you need to be prepared to spend time doing iterative optimization on the big bet to see if it has the potential to eventually surpass control. If one of these bets open up a whole new area, the team might transition back to the Growth Stage.

Conclusion

Take all the percentage allocations in this post as just a rough guideline. However, every leader in Growth should be actively thinking about and managing their portfolio and their team processes that produce that portfolio. Make sure you are maximizing your return through really assessing and improving your project selection process. Build a culture that not only empowers, but requires, everyone to think about how to help their team hit its goals. Finally, understand what stage you are in and look ahead, out in front of the team, to anticipate how your portfolio allocation needs to change to ensure the team’s long-term success.


Increase funnel conversion with Psych

Every year engineers on the Pinterest Growth team organize an internal conference called Growthcon. The goal of Growthcon is help share learnings, insights, and best practices from across all the teams in Growth. Every Growthcon has a mix of talks from internal speakers, breakout learning labs, and a keynote speaker. For this year’s keynote we invited Darius Contractor, who has led Growth at Airtable, Facebook Messenger, and Dropbox, to come give a talk about his Psych framework for funnel optimization.

Darius dissects flows from Match.com, Hooked, Airbnb, and Airtable and walks through step by step how you can use the psych framework and user psychology to understand what will make a user convert through a flow. Watch the video below to learn about how you can apply the psych framework to your conversion rate optimization efforts.


Measuring Incrementality For Emails @ Netflix

Chris Beaumont, a Data Scientist at Netflix, recently gave a talk at the SF Growth Engineering Meetup on a novel new approach Netflix took to continuously measure and understanding the incremental impact different emails had on subscriber growth. Chris expands on the original blog post he published to go more in depth on how Netflix created an automated system to do per-type holdouts and how they analyzed the causal impact each email and push notification had on different business KPIs. He also discusses how this approach is an improvement upon traditional A/B testing or just monitoring click and open rates. Watch the video to learn more.


5 Principles For Goaling Your Growth Team

There are tons of posts on how to set a Growth team up for success from a hiring perspective, process perspective, tooling perspective, etc. However, one of the most important things to get right is setting up what each team is goaled on. This is especially true as a Growth Org starts to scale with multiple teams working in different areas, developing their own strategies, and each team figuring out how to drive their metrics up and to the right. It becomes critical that the goals and metrics are architected in a way to ensure each team is building towards a long term sustainable business.

Casey Winters wrote a great post on 5 mistakes to avoid when setting goals for a Growth team and why you should set goals on absolute numbers instead of percentages. In this post, I want to build on that and share 5 guiding principles I’ve found to be effective when architecting goals for a team, ensuring the team is aligned with the rest of the company and setting them up for long term success.


Principle #1: Isolation

The first key ingredient for a team level goal is making sure that it is a metric that the team can directly influence and has some degree of isolation from other teams, seasonality, etc. Team level goals should be a yardstick against which the team can measure progress. However, if that metric can be heavily influenced by other teams, by seasonality, or other factors outside of the team’s control, it starts to lose value as a way for the team to measure its impact and progress.

At Pinterest, the way each team in Growth measures its progress is by calculating the absolute number of incremental Weekly Active Users added by every A/B experiment run and summing up that impact over the quarter. By using A/B experiments to measure each team’s impact, the A/B experimentation framework provides isolation between teams, even when teams work in overlapping areas. The one downside of summing up experiment impact is that it has a tendency to overestimate the impact. Another approach is having team level holdouts for every experiment they run in the quarter, which can result in a more accurate measure of a team’s impact, but at the cost of significant additional engineering maintenance and overhead.


Principle #2: Avoid Misalignments

The second key ingredient of a team goal is making sure it does not put you at odds with other teams in the company. I recall on one occasion speaking to a Growth PM and they were complaining that their team goal was to grow the total number of registered users with the app installed. On the surface, this might seem like a fine metric. The problem was that this metric put them directly at odds with the Notifications team. This is because any time the Notifications team would send a push notification, some small portion of users will delete the app. Misalignments like this suggest that optimizing that metric might not correlate 100% to business success.

One possible way to overcome this is by having multiple teams in Growth all work to drive the same metric while defining swim lanes and areas of ownership to ensure each team has a clear charter. For instance, at Pinterest, most teams in Growth goal on Weekly Active Users, and each team has clear areas they own such as Emails & Notifications, or Signups & Logins.


Principle #3: Tied to Long Term Success

            The third key ingredient of a team metric is tying it to long-term business success. Growth teams are hyper metric focused and even with the best intentions, they can sometimes over optimize for a metric. To counteract this, you want to ensure that metrics cannot easily be “gamed” and that they are tied to the long-term success of the company. You can do this by going deeper than the surface level metrics and setting goals based on down funnel engagement.

A simple example is signups. It is natural for a team focused on user acquisition to perhaps goal on signups as the metric they drive. However, signups are a metric that can relatively easily be juiced in ways that might not lead to the best long-term outcomes. For instance, you can remove steps from the signup flow to get more users through the signup funnel, but those steps may be important in significantly improving the user experience once the users are in the product. Or perhaps, the acquisition team starts driving a ton of signups from low-quality traffic sources and signing up a ton of users that end up not sticking around. A better metric for a team focused on acquisition might be a metric like activated signups, where they only count signups that result in a long-term retained user. In this way, the team is ensuring the metric they are trying to drive is always aligned with long term business success.


Principle #4: Guardrails

Even with metrics that are tied to long term success, it can sometimes be necessary to setup guardrails to protect the user experience. A great example is emails and notifications; sending more emails always lifts engagement. Even if those additional emails result in more unsubscribes, those unsubscribes never overcome the lift in active users from just sending more. Intuitively though, everyone knows that there can be a long-term cost to sending too many emails which can cause user fatigue or brand perception. The problem is the long-term cost doesn’t appear in days or weeks, but over years.  To help protect the user experience, the team needs to establish guardrail metrics around unsubscribe rates and spam complaint rates to help protect the user experience while they drive towards their goal. The guardrail metrics would ensure that optimizing their northstar metric of active users isn’t at the expense of user experience.

Guardrails can also be helpful as a cross-check for the main metric the team focuses on to help catch potential issues. For instance, if the Emails & Notifications team decides to measure its impact through A/B experiments, it is important to setup a cross-check metric for the team to track the health of the channel outside of experiments. If a particular ISP starts marking the email as spam, it could significantly impact the business and the team needs to be able to catch that. The team would need to setup a guardrail metric like daily email clicks, or even better, daily engaged sessions from email, to ensure the team can catch and identify issues that fall outside of experiments.


Principle #5: KISS

            Finally, there is a well-known principle in Computer Science called KISS, which is an acronym that stands for “Keep it simple, stupid.” This principle was originally created by the Navy and states that most systems work best if they are kept simple rather than made complicated. With metrics, it can be easy to get a bit carried away and create extremely complex metrics or have several different metrics that a team is responsible for driving. When designing team metrics or a team goal, try not to overcomplicate things and just keep it simple, stupid.

The 27 Metrics in Pinterest’s Internal Growth Dashboard

One question I often get asked by people starting out on growth is “what metrics should be in my growth dashboard?”. I’ve written before about what metrics we value at Pinterest. In this post however, I’ll give people a peek behind the scenes and share what our internal growth dashboard looks like.

We have organized our dashboard to reflect our user growth model. We start with our top line growth metric of MAUs. Then we follow the user lifecycle funnel; starting with acquisition metrics, followed by activation, engagement, and finally resurrection.

Pinterest Growth Model


MAUs

1. Current progress to goal: Current number of MAUs & how much progress we’ve made towards our quarterly MAU goal.

2. MAU Forecast: Forecast of the number of MAUs we could expect to have extrapolated from our growth rate at the same time during previous years. We include this metric to help us anticipate the effect of seasonality on our growth numbers.

3. MAUs by app

4. MAUs by gender

5. MAUs by country: Tracking total number of MAUs in every single country would obviously be overwhelming to view on a chart, so instead we bucket countries together. The buckets we use are USA, Tier 1, Tier 2, Tier 3, and Rest of World. The tiers are based on size of Internet population, Internet ad spending, etc.

6. MAU Accounting: The MAU accounting helps us see what factors are contributing the most to our MAU growth. Specifically we split out total number of signups, resurrections, existing users churning out and new users churning out.

Growth MAU Accounting


Acquisition

7. Total signups

8. Signups by app

9. Signups by referrer

Signups by referrer

10, 11, 12. Invites Sent, Unique Invite Senders, and Invite Signups


Activation

 13. Overall Activation Rate: 1d7s is a term we use to refer to users who come back 1 or more times in the week following signup. We measure overall activation rate as 1d7s/signups, or in other words, the percentage of new signups that visit Pinterest again in the week following signup.

 14. Activation by app: This is the same metric of 1d7s/signups split out by platform. We’ve seen that different platforms can actually have pretty dramatic differences in activation rates.

15. Activation by referrer source

16. Activation by gender

Activation rate by gender

17. Overall signups to 1rc7: This metric is similar to the signups to 1d7 except it measures the percentage of new signups that repinned a pin or clicked on a pin in the week following signup. We use this metric to measure as a leading indicator of how well we are activating users into the highly engaged user buckets

 18. 1rc7s by app

19. Signups to 1rc7 ratio by app

20. Signups to engagement funnel by app: This metric tracks the percentage of new signups that are still doing key actions during a one-week time window of 28-35 days after signup. Specifically, we track 35 days after a user signs up, what percentage of them are still an MAU, WARC (weekly active repinner or clicker), WAC (weekly active clicker), or WAR (weekly active repinner).

21. Signup engagement funnel by gender

22. Signups to WAU 35 days after signup: This is one of our key activation metrics. We track the total percentage of users who are still a WAU one month after signup.  Specifically we look to see what percentage of signups were active between 28-35 days after signup.


Engagement

 23. *AU ratios: We track the ratio of DAUs to MAUs, WAUs to MAUs, and DAUs to WAUs. The ratio between *AUs is a popular metric to gauge how engaged users are with your app.

*AU ratios

24. Email Summary by type: Table of total number of emails sent, opened, & clicked-through split out by email type.

25. Push notification summary by type: Table of total number of push notifications sent & opened split out by type and by platform (iOS & Android).


Resurrections

26. Resurrections by platform: Total number of users that were dormant for 28+ days, but then came back to Pinterest, split out by which platform they came back on.

27. Resurrections by referrer

Retention rates by referrer

To wrap up, you can see we put a big emphasis on activation (the process of getting a new user to convert to a MAU). This is because we consider activation critical to long-term sustainable growth. Strong activation rates are necessary if you want to be able to scale a service to hundreds of millions of users.  We also put an emphasis on segmentation by gender, country, referrer, etc., to more deeply understand how different segments of users interact with Pinterest and see which segments are underperforming. If you have any questions feel free to ping me on twitter or drop me a line.

4 Metrics Every Growth Hacker Should Be Watching

The metrics typically advertised by startups are total users, daily active users (DAU), and monthly active users (MAU). While these numbers might be good to share with the press, they are only vanity metrics because they don’t give any real insight into your growth rate or the quality of the users you’re bringing in. Here are 4 metrics you should really be paying attention to if you’re trying to drive sustainable user growth.

Daily Net Change – Daily net change tells you on a daily basis how much you’re user base has grown (or shrunk). In a single graph you can assess new user acquisition, re-engagement, and retention and can easily see the impact of each component on your current growth rate.

Here is the breakdown of the different components and how they are calculated:

New Users: how many new users joined the service today?

Reactivated Users: how many existing users used the service today for the first time in 28 days?

Churned Users: how many existing users last used the service exactly 28 days ago?

Net change: new + reactivated – churned

Net Change Graph

Growth Metric: Net Change in Users


Core Daily Actives – The problem with the daily active user metric is there is not concept of quality users or retention. You will often see DAUs jump from a user acquisition campaign, but it is impossible to tell from the metric if those users are immediately dropping off or if they are sticking around. Core Daily Actives rises above this noise by only counting users that have been using your service on a regular basis. To get this metric, you calculate the number of users that used your service today who also used your service 5 or more times in the past 4 weeks. This metric is much more useful than DAUs because it focuses on the bottom line: growth of repeat users.

Cohort Activity Heatmap – The cohort activity heatmap is by far my favorite because it is the most insightful metric on this list. What the metric shows is how your user retention curve has changed over time. It can be a bit complex to read at first because so much data is crammed into a single graph, but it is very powerful once you know how to use it.

This is how you interpret the graph:

  • The unit of the x-axis is days and each column corresponds to the group of users that joined on day X (each group is called a cohort)
  • The width of a column on the x-axis represents the size of the cohort (i.e. the wider the column, the more users joined on that day)
  • The unit of the y-axis is also days and each row represents Y days after the cohort joined the service. The bottom row of the graph represents day 0, the very first day the user joined the service, and the top row represents day 59.
  •  The color of each rectangle represents activity level. It is calculated by determining the percentage of users that joined day X and used the service on day Y. The scale ranges from red for a high percentage to blue for a low percentage.

 Cohort Activity HeatmapGrowth Hacker Metric: Cohort Activity Heatmap


Conversion Funnel – The final metric is tracking the conversion funnel for flows that affect new user acquisition, retention or re-engagement. A conversion funnel is simply splitting up a process into its constituent steps and tracking how many users make it through each step. This metric is widely used, but it is common to analyze the conversion funnel for a flow once or very infrequently. Really, the conversion funnel for important flows should be tracked on a daily basis for adverse changes because even a difference of a few percentage points can compound over time.

This is an example of the conversion funnel for inviting users to a service.

1)   How many users saw the invite prompt?

2)   What percent of users clicked on the invite prompt?

3)   How many invites were sent per user that clicked on the prompt?

4)   What percent of invites were viewed?

5)   What percent of invitees clicked on the link in the invite?

6)   What percent of invitees that clicked on the link, joined the service?

7)   How many new users joined the service as a result of the invite.


This is just a sampling of some of my favorite growth hacking metrics. There are many others and usually the best metrics for you depends on your situation. If you know any metrics that you think should have been on this list, please drop me a line.